Statistics
Make sure you are familiar with the BIDS stats model, before you embark on to statistical analysis.
Statistics workflows
Note
The illustrations in this section mix what the files created by each workflow
and the functions and are called by it.
In this sense they are not pure DAGs (directed acyclic graphs) as the *.m files
mentioned in them already exist.
Subject level
After the specification step an output folder is created. To get the fullpath of that folder you can use:
getFFXdir(subLabel, opt)
A typical folder will contain:
bidspm-stats/sub-01/stats/task-audio_space-IXI549Space_FWHM-6
├── SPM.mat
├── sub-01_task-audio_space-IXI549Space_desc-beforeEstimation_designmatrix.png
├── sub-01_task-audio_run-01_desc-confounds_regressors.mat
├── sub-01_task-audio_run-01_desc-confounds_regressors.tsv
├── sub-01_task-audio_run-01_onsets.mat
└── sub-01_task-audio_run-01_onsets.tsv
Each run should have a pair of tsv/mat files:
One that summarises the onsets used for that design.
One that summarises the regressors confounds used for that design.
In most cases those are going to be a subset of the content:
of the
_events.tsvfrom the raw BIDS datasetof the
_regressors.tsvfrom the deriratives BIDS dataset containing the preprocessed data.
What part of the _events.tsv and _regressors.tsv gets into the final GLM specification depends on the BIDS statistical model used.
The mat files can directly be ingested by SPM: the TSV files are there for both logging and interoperability.

Subject level GLM specification workflow for model specification
Compute results

Example of subject level results from the MoAE demo
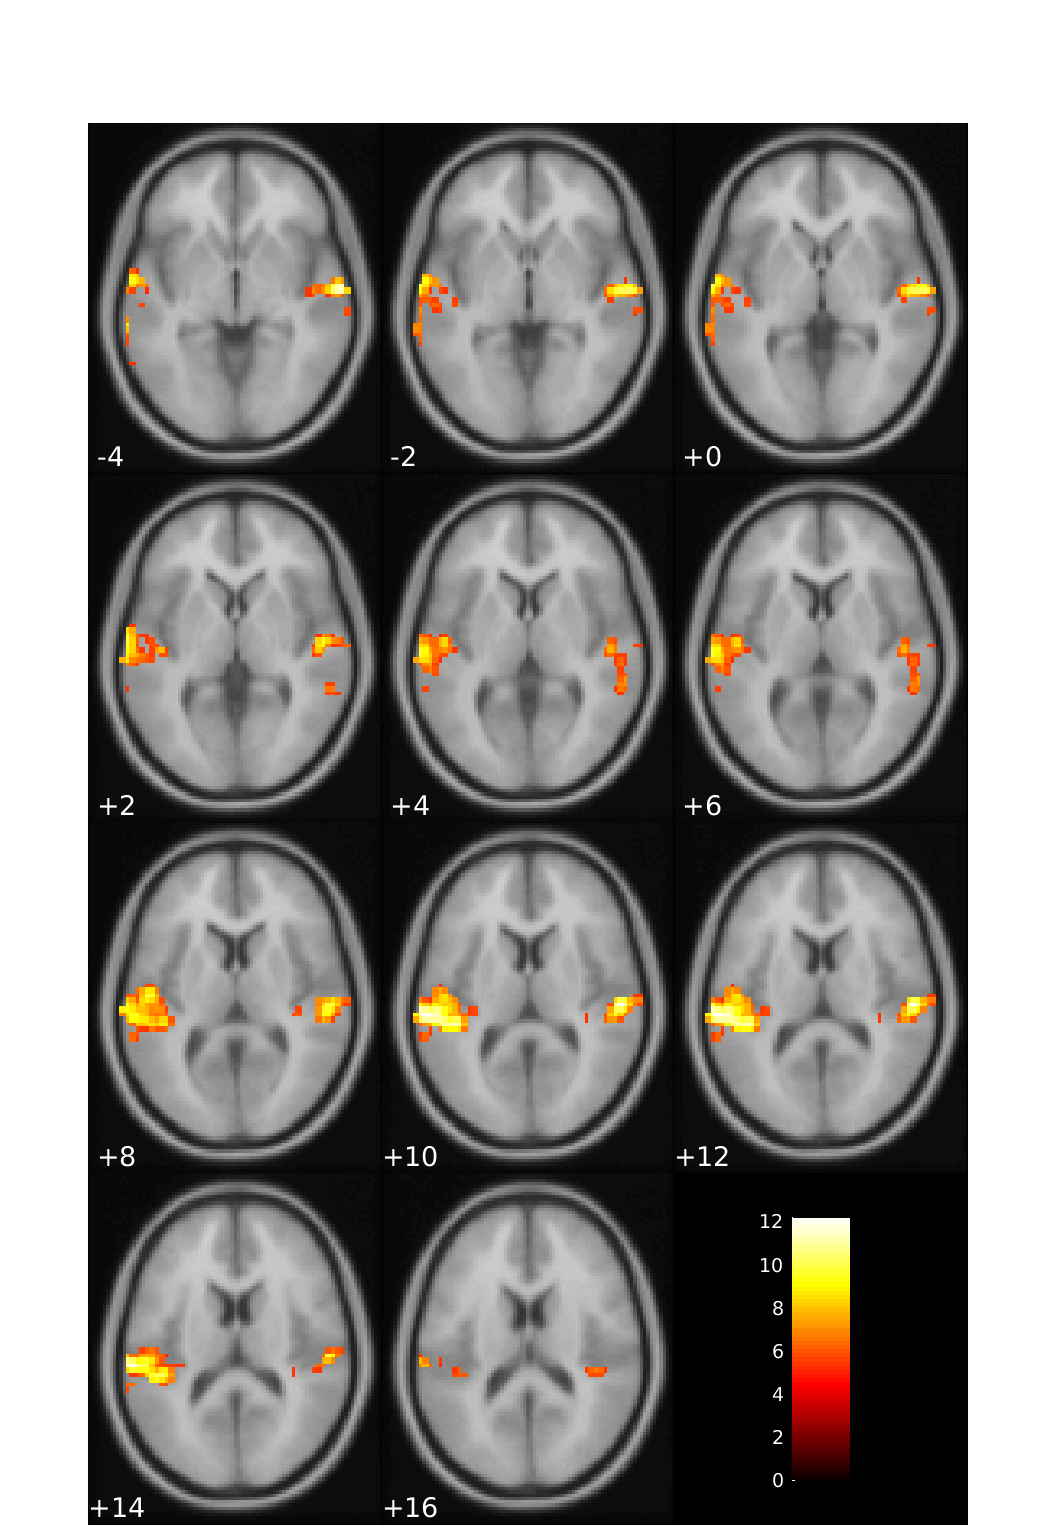
Example of subject level montage from the MoAE demo
bidspm also includes the slice_display code that allows you to plot on the
same figure:
beta values
t values
cluster boundaries
ROI boundaries
An example of how to use it is available in the moae_04_slice_display.m
script in the MoAE demo.

Example of subject level slice display from the MoAE demo